Investment Optimiser: how to split a property budget by risk and return
The Investment Optimiser splits an investment budget across the properties you are weighing up. You give it a price, a rent yield, a growth rate and how much the yearly return could swing for each, how much risk you can take and the return you are aiming for; it finds the split with the most return for that risk, the way a portfolio is balanced, and never puts more into a property than its price allows. On the starting example, $1,000,000 across three properties, the faster growing house takes 9% at a careful setting, 14% in the middle and 22% at a bold one. The answer is only as good as the figures you give it.
Figures as at 22 October 2026: the figures are the ones you enter; the starting figures are an example, not market data
- 8.1%
- expected return a year of the suggested split on the starting example, middle setting.
- 9% to 22%
- the faster growing house's share, from a careful to a bold setting, on the same example.
- House
- $141,452 (14%)
- Townhouse
- $358,548 (36%)
- Unit
- $500,000 (50%)
- Value after 10 years at that return
- $2,173,105
- Your target of 7% a year is reached.
- No property gets more than its price's share of the budget. A more careful setting moves money to the properties whose return swings least.
- Only as good as the figures you give it: it does not know a suburb, a market or a future rate.
Presm's Investment Optimiser, the app's own engine: the split with the most return for the risk you take, on your figures. Swing is how much a property's yearly return could vary. Not financial advice.
The starting example at three risk settings
How the optimiser splits $1,000,000 across the three example properties as the risk setting changes, with the expected return and risk of each split. Every figure is worked out by the calculator above.
| Property | Careful (2 of 10) | Middle (5 of 10) | Bold (9 of 10) |
|---|---|---|---|
| House | $84,720 (9%) | $141,452 (14%) | $217,095 (22%) |
| Townhouse | $415,280 (42%) | $358,548 (36%) | $282,905 (28%) |
| Unit | $500,000 (50%) | $500,000 (50%) | $500,000 (50%) |
| Expected return a year | 8% | 8.1% | 8.1% |
| Risk | 8.9%, medium | 9%, medium | 9.2%, medium |
Presm's Investment Optimiser on the example figures in the calculator, a target return of 7% a year. Not a recommendation.
How the optimiser works
For each property it adds the rent yield and the growth you expect into a return, and takes your swing figure as how much that return could vary from year to year. Properties of the same kind are assumed to move partly together (a correlation of 0.6 for two homes). It then finds the split with the most return for the risk your setting allows, nudged toward your target, and never puts more into a property than its price's share of the budget. A careful setting weighs the swings heavily and moves money to the steadier properties; a bold one weighs them lightly and moves money to those expected to return more. It does not know a suburb, a market or a future rate: the answer is only as good as your figures.
One number is a start. Presm shows the whole picture.
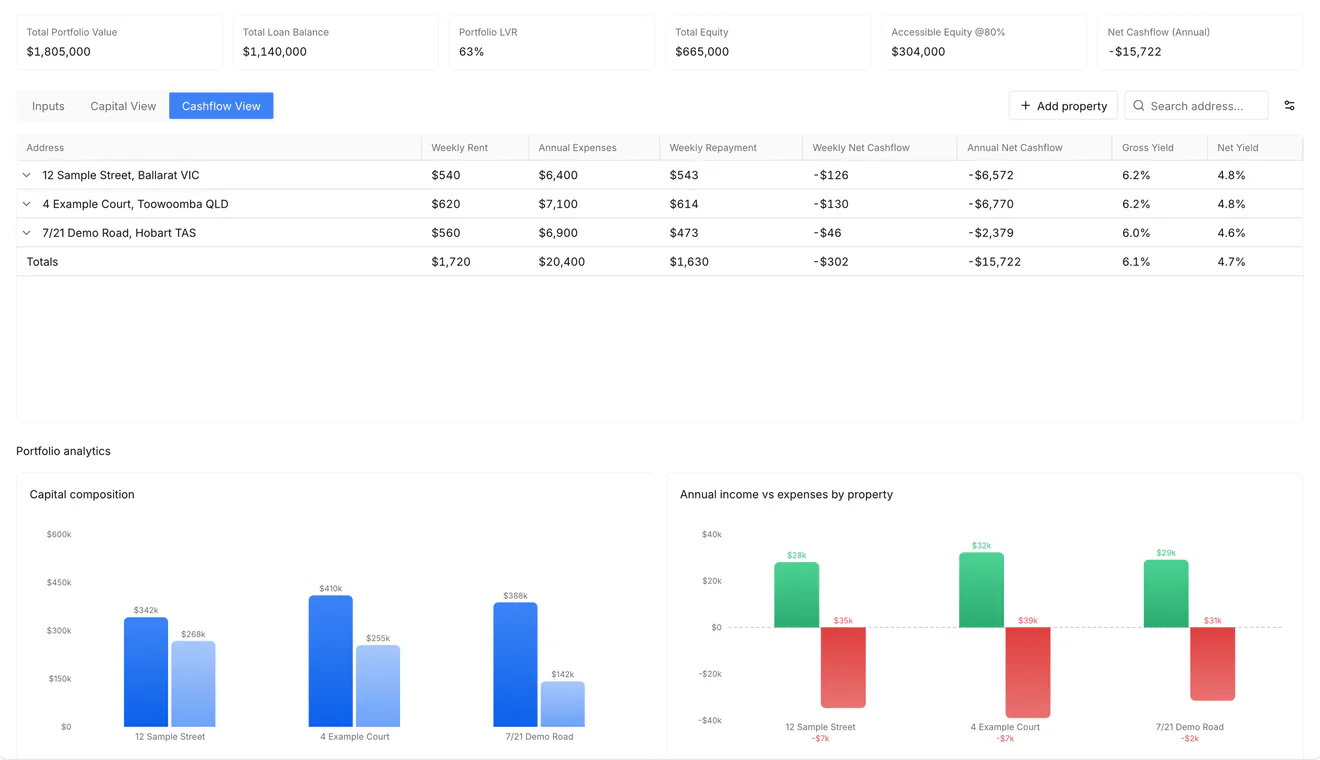
A split is a start. In Presm the properties you own sit in one table, with their value, loans and cash flow, and The Plan shows what the next purchase would change.
- Portfolio. Value, loans, LVR, equity and cash flow for every property you own, in one table.
- Holding costs. What each property costs you weekly, monthly or yearly, every cost on one card.
- The Plan. Add the next property and see what changes, 10, 20 or 30 years ahead.
- Calculators. Stamp duty, land tax, borrowing power, LMI and more, in one account.
Want a strategist? Book a discovery call with Rising Returns